ITowns is a javascript framework for 3D geographic data visualisation. It can display a wide range of data such as ortho-images, Digital Elevation Models (DEM) or 3D models.
ITowns is based on Three.js, which is a javascript library that implements WebGL to render sophisticated 3D Geometry on a webpage.
In this tutorial, we shall be introduced to the fundamentals of iTowns : how it displays geographic data.
The View
The support to display anything within iTowns is called a View.
To provide geographic data visualization, a View contains a combination of Layers which, in a digital map environment, are visual representations of any geographic data.
In other words, all data that are displayed using iTowns are supported by some Layer.
Each View in iTowns displays 3D data in a unique Coordinates Reference System (CRS).
Yet, the data displayed within a View do not necessarily have to be in the View's CRS.
ITowns comes with two pre-made View types : GlobeView and PlanarView.
Each of these allows visualizing data from different types (raster or vector) and from different CRS.
On this matter, iTowns distinguishes two cases :
- The first one regards data that are to be displayed as raster.
These data can either be original raster data or vector data which are rasterized by iTowns and projected on the ground.
Data from this type are displayed in a
GlobeViewif their source CRS is WGS 84 or Pseudo-Mercator. However, if their source CRS defines a local projection (such as RGF93 / Lambert 93 for instance), they are displayed in aPlanarView. - On another hand, vector data that are to be displayed as 3D objects can be displayed in any type of
View, regardless of their source CRS since they can be converted by iTowns.
It is important to acknowledge the following facts regarding original raster data and Views :
- a
GlobeViewallows displaying multiple raster data from two different source CRS : WGS 84 and Pseudo-Mercator, - a
PlanarViewallows displaying multiple raster data, but all those data sources must have the same CRS.
Protocols and data formats
ITowns comes with a wide range of compatible data sources. All available sources can be seen in the Source section of the
API documentation.
iTowns supports all the main geographic protocols: Web Map Service with WMSSource,
Web Map Tiled Service with WMTSSource, Web Feature Service
with WFSSource and Tile Map Service and XYZ with TMSSource.
iTowns also has sources for many data formats: vector tile resources from MapBox with VectorTilesSource, Potree (PotreeSource) and
Entwine (EntwinePointTileSource) 3D point clouds, 3DTiles
mesh (b3dm) and point clouds (pnts) from web servers (OGC3DTilesSource), from Cesium ion OGC3DTilesIonSource and from the Google API OGC3DTilesGoogleSource,
GeoJSON with FileSource and GeoJsonParser,
KML with FileSource and KMLParser, GPX
with FileSource and GpxParser and oriented images with OrientedImageSource.
It is also possible to create your own source and/or your own parser to read and add data from any format or protocol that is not supported by itowns.
Layers
It was earlier mentioned that data are displayed as Layers within iTowns.
Several specific types of Layers exist, the use of which depends on the data to display :
ColorLayercan be used to display raster graphics or vector data that needs to be rasterized to be projected on the ground (left picture in the table bellow),ElevationLayercan be used to display 3D elevation models (center picture in the table bellow),GeometryLayercan be used to display 2D vector data or 3D objects, such as geometric shapes or buildings modelling (right picture in the table bellow).FeatureGeometryLayeris a pre-configuredGeometryLayerwhich simplifies its implementation in given cases (e.g. to extrude 3D buildings).PointCloudLayercan be used to display 3D point clouds. Any point cloud formats are supported as long as the correspondingSourceis provided. Some point clouds formats such as Potree, Las and Entwine already have parsers defined in itowns that you can use. For 3D Tiles point clouds (pnts), useOGC3DTilesLayer.OGC3DTilesLayercan be used to display 3D Tiles datasets in version 1.0 (b3dm, pnts and gltf tiles are supported).OrientedImageLayercan be used to display oriented images.
 |
 |
 |
|---|---|---|
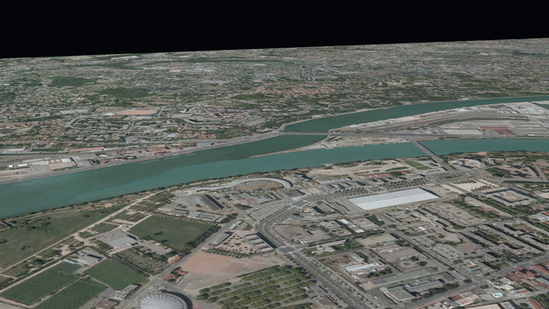
A simple ColorLayer is displayed |
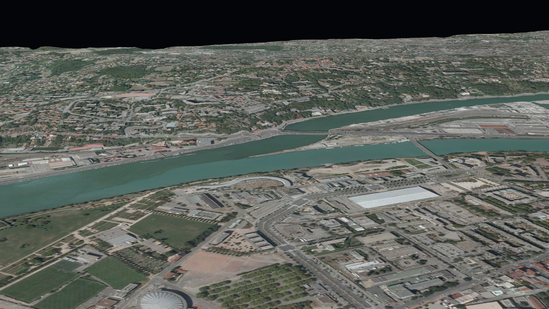
An ElevationLayer is added to represent terrain elevation |
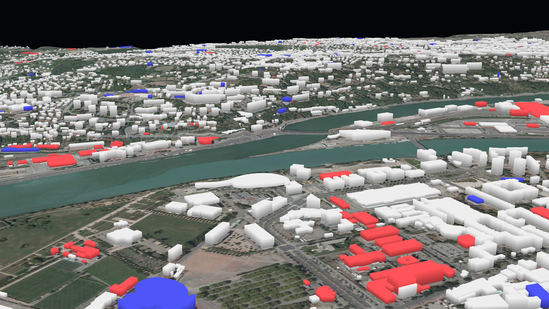
A GeometryLayer is added to model the buildings |
Note that ColorLayer and ElevationLayer don't have their own geometry and are always attached to a GeometryLayer (generally the layer representing the geometry of the globe or of the plane). ColorLayer are projected onto this GeometryLayer and ElevationLayer are used to read elevation and to apply it to a GeometryLayer.
Style
ITowns can display vector data in two ways : the data can be displayed in a View as 3D objects, or as entities that are projected on the ground.
You can see bellow pictures illustrating the two cases.
 |
 |
|---|---|
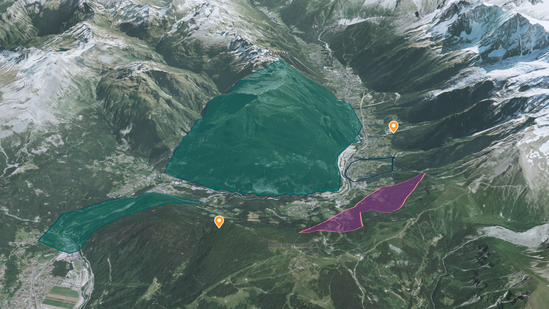
| Vector data projected on the ground | Vector data display as 3D objects |
In both ways, the appearance and positioning of the vector data can be adjusted by modifying the Style parameter of the Layer the data are displayed in.
The Style in iTowns comes with several properties :
fillallows defining style rules for polygons interior,strokeallows defining style rules for lines and polygons edges,pointallows defining style rules for points.
Each of these three properties comes with a bunch of parameters to set vector data appearance and positioning, such as color, opacity, width, base_altitude...
You can find a list of all the possible parameters in Style documentation.
These parameters can be set as static values or as functions of the vector data properties.
For example, let's suppose some vector data contains polygons.
Setting fill.color to red will color all the polygons in red.
If on another hand, all polygons come with a color property within the vector data, you can access it within Style in two ways :
- either by using brackets, which in our example results in setting
fill.colorto'{color}'; - or by passing a method to the
fill.colorvalue. The first parameter of this method will automatically be an object containing all the properties of the vector data. In our example, the method could simply return thecolorproperty.
ITowns offers the possibility to display labels attached to points.
The content and appearance of the labels can be set the same way as for the polygons, lines and points : using a Style property which is called text.
For instance, setting text.field to '{name}' will display a label on each point that has a name property within the vector data.
The content of the label will be the content stored in the data under the name property.
Vector data projected on the ground
When vector data are flattened on the ground, they are displayed in a ColorLayer.
In that case, the data basically consist in polygons, lines or points.
Their appearance can be adjusted by modifying the Style of the ColorLayer.
Yet, their positioning can't be modified since it is computed so that tey appear projected on the ground.
Vector data displayed as 3D objects
In the case of vector data represented as 3D objects, the data are displayed in a GeometryLayer.
The appearance and positioning of the vector data can be adjusted by modifying the Style of the GeometryLayer.
Two parameters allow modifying the data position :
base_altitudewhich defines the altitude at the base of the 3D objects ;extrusion_heightwhich defines the height of the 3D objects, giving them volume.
For example, given a set of polygons, setting fill.base_altitude to 500 and fill.extrusion_height to 20 will render extruded polygon expanding between 500 and 520 meters of altitude.