The goal of this tutorial is to give a brief example on how to use iTowns to visualize some vector data as 3D objects.
The vector data we will use in this tutorial represent buildings and will be displayed on the GlobeView we created in the WGS84 tutorial.
Preparing the field
To display our buildings, we are going to use the data created in the WGS84 tutorial. As we are trying to display some buildings, let's move closer to the ground to see something and let's give the camera an initial rotation. For this, we need to change the starting position to something more appropriate. We also need to modify the elevation layer to a more precise one.
<!DOCTYPE html>
<html>
    <head>
        <meta charset="UTF-8">
        <title>Vector data in 3D</title>
        <style>
            html { height: 100%; }
            body { margin: 0; overflow: hidden; height: 100%; }
            #viewerDiv { margin: auto; height: 100%; width: 100%; padding: 0; }
            canvas { display: block }
        </style>
     </head>
     <body>
        <div id="viewerDiv"></div>
        <script src="../dist/itowns.js"></script>
        <script type="text/javascript">
            var viewerDiv = document.getElementById('viewerDiv');
            var placement = {
                coord: new itowns.Coordinates('EPSG:4326', 4.818, 45.7354),
                range: 1000,
                tilt: 20,
            };
            var view = new itowns.GlobeView(viewerDiv, placement);

            var colorSource = new itowns.WMTSSource({
                url: 'https://data.geopf.fr/wmts?',
                crs: 'EPSG:3857',
                name: 'ORTHOIMAGERY.ORTHOPHOTOS',
                tileMatrixSet: 'PM',
                format: 'image/jpeg'
            });

            var colorLayer = new itowns.ColorLayer('Ortho', {
                source: colorSource,
            });

            view.addLayer(colorLayer);

            var elevationSource = new itowns.WMTSSource({
                url: 'https://data.geopf.fr/wmts?',
                crs: 'EPSG:4326',
                name: 'ELEVATION.ELEVATIONGRIDCOVERAGE.HIGHRES',
                tileMatrixSet: 'WGS84G',
                format: 'image/x-bil;bits=32',
                tileMatrixSetLimits: {
                    11: {
                        minTileRow: 442,
                        maxTileRow: 1267,
                        minTileCol: 1344,
                        maxTileCol: 2683
                    },
                    12: {
                        minTileRow: 885,
                        maxTileRow: 2343,
                        minTileCol: 3978,
                        maxTileCol: 5126
                    },
                    13: {
                        minTileRow: 1770,
                        maxTileRow: 4687,
                        minTileCol: 7957,
                        maxTileCol: 10253
                    },
                    14: {
                        minTileRow: 3540,
                        maxTileRow: 9375,
                        minTileCol: 15914,
                        maxTileCol: 20507
                    }
                }
            });

            var elevationLayer = new itowns.ElevationLayer('MNT_WORLD', {
                source: elevationSource,
            });

            view.addLayer(elevationLayer);
        </script>
     </body>
</html>
Adding a GeometryLayer
We will use a WFS stream that provides buildings footprints geometries and altitude information for each building.
We will display the buildings by extruding the building footprints to the altitude value. iTowns provides a specific
layer for such usecases: FeatureGeometryLayer (which is a pre-configured type of GeometryLayer).
Before creating this layer, let's instantiate the data source:
var geometrySource = new itowns.WFSSource({
    url: 'https://data.geopf.fr/wfs/ows?',
    version: '2.0.0',
    typeName: 'BDTOPO_V3:batiment',
    crs: 'EPSG:4326',
    ipr: 'IGN',
    format: 'application/json',
});
With our source instantiated, we can create our FeatureGeometryLayer, giving it the usual id and source parameters :
var geometryLayer = new itowns.FeatureGeometryLayer('Buildings', {
    source: geometrySource,
    zoom: { min: 14 },
});

view.addLayer(geometryLayer);
We also added a minimal zoom parameter to prevent our data being displayed before a certain
zoom level at which we would be too far from the data to distinguish the buildings.
Trying this code will result visually in the following.
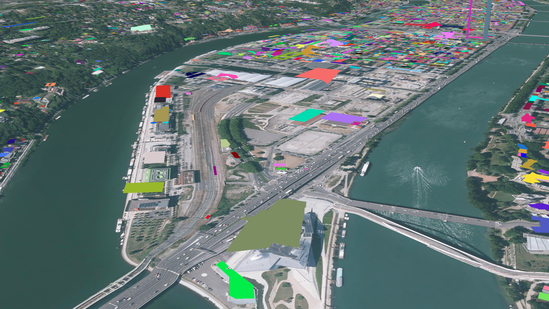
We can see the polygons fetched from the data source, each representing a building. However, these polygons are not yet placed on the ground. Indeed, they were placed after the 3D positions stored in the data, which in our case represent points on the roof of buildings. So let's start modifying these polygons' altitude to place them on the ground !
Placing the data on the ground
To achieve the positioning relative to the elevation layer, we will need to add
a parameter to the FeatureGeometryLayer, which is its Style.
As mentioned in the fundamentals tutorial, we can modify the appearance and positioning of polygons thanks to the fill property of Style.
The altitude at which polygons are displayed can be modified using the base_altitude parameter, which we set as follows :
function setAltitude(properties) {
    console.log(properties);
}

var geometrySource = new itowns.WFSSource({
    url: 'https://data.geopf.fr/wfs/ows?',
    version: '2.0.0',
    typeName: 'BDTOPO_V3:batiment',
    crs: 'EPSG:4326',
    ipr: 'IGN',
    format: 'application/json',
});

var geometryLayer = new itowns.FeatureGeometryLayer('Buildings', {
    source: geometrySource,
    zoom: { min: 14 },
    style: {
        fill: {
            base_altitude: setAltitude,
        }
    },
});

view.addLayer(geometryLayer);
If we take a look using console.log(properties); at what we have in the
properties object, we will get a lot of output. Our data being constituted of
multiple buildings, we get an output for each building. Looking closer to an
output, here is what we can obtain :
geometry_name: "the_geom"
hauteur: 9
id: "bati_indifferencie.19138409"
origin_bat: "Cadastre"
prec_alti: 5
prec_plani: 2.5
z_max: 83.7
z_min: 83.7
Reading the documentation of the database we are querying (section 7.2, page
66, in French), we have an
explanation on each property. To help us place the data correctly, let's use the
altitude_minimale_sol property.
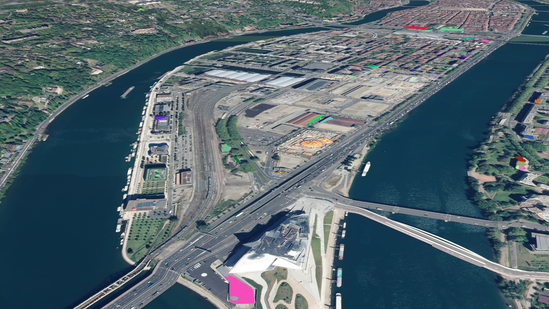
It corresponds to the minimal altitude of the building floor.
function setAltitude(properties) {
    return properties.altitude_minimale_sol;
}
Now we can't see completely our buildings. What can we do about that ? Let's give them volume !
Extruding the data
Like the altitude, the volume of buildings can be changed using the extrusion_height
parameter of the Style.fill property.
function setExtrusion(properties) {
    return properties.hauteur;
}

var geometrySource = new itowns.WFSSource({
    url: 'https://data.geopf.fr/wfs/ows?',
    version: '2.0.0',
    typeName: 'BDTOPO_V3:batiment',
    crs: 'EPSG:4326',
    ipr: 'IGN',
    format: 'application/json',
});

var geometryLayer = new itowns.FeatureGeometryLayer('Buildings', {
    source: geometrySource,
    zoom: { min: 14 },
    style: {
        fill: {
            base_altitude: setAltitude,
            extrusion_height: setExtrusion,
        }
    },
});

view.addLayer(geometryLayer);
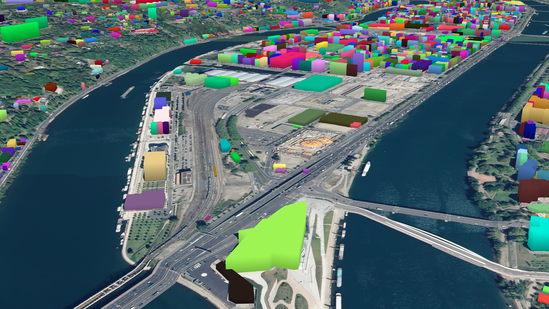
The parameter properties of the setExtrusion method is the same as in
setAltitude. We noticed there is a hauteur (height) property that
we could use to set the height of the building. Moving around with this gives a
nice view of our buildings :
Coloring the data
We are not yet touching the color of the buildings. This results in every
building being randomly colored at each time. To solve this, as we did before,
we can add a color parameter to the Style.fill property.
function setColor(properties) {
    return new itowns.THREE.Color(0xaaaaaa);
}

var geometrySource = new itowns.WFSSource({
    url: 'https://data.geopf.fr/wfs/ows?',
    version: '2.0.0',
    typeName: 'BDTOPO_V3:batiment',
    crs: 'EPSG:4326',
    ipr: 'IGN',
    format: 'application/json',
});

var geometryLayer = new itowns.FeatureGeometryLayer('Buildings', {
    source: geometrySource,
    zoom: { min: 14 },
    style: {
        fill: {
            color: setColor,
            base_altitude: setAltitude,
            extrusion_height: setExtrusion,
        },
    },
});

view.addLayer(geometryLayer);
For each building, a new color is created (using THREE.Color), and this results
in all buildings being colored in a light gray.
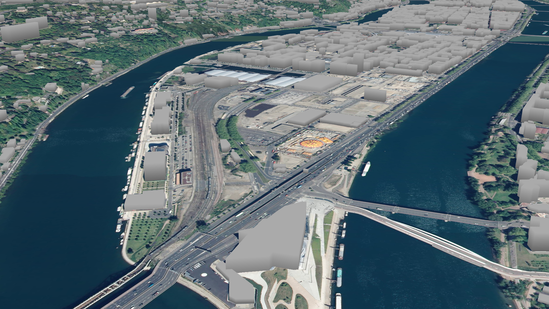
Result
Congratulations ! By reaching here, we know how to display a simple FeatureGeometryLayer
on a GlobeView, and change the appearance and positioning of this layer. Here is the final code:
<!DOCTYPE html>
<html>
    <head>
        <meta charset="UTF-8">
        <title>Vector data in 3D</title>
        <style>
            html { height: 100%; }
            body { margin: 0; overflow: hidden; height: 100%; }
            #viewerDiv { margin: auto; height: 100%; width: 100%; padding: 0; }
            canvas { display: block }
        </style>
     </head>
     <body>
        <div id="viewerDiv"></div>
        <script src="../dist/itowns.js"></script>
        <script type="text/javascript">
            var viewerDiv = document.getElementById('viewerDiv');
            var placement = {
                coord: new itowns.Coordinates('EPSG:4326', 4.818, 45.7354),
                range: 1E3,
                tilt: 20,
            };
            var view = new itowns.GlobeView(viewerDiv, placement);

            var colorSource = new itowns.WMTSSource({
                url: 'https://data.geopf.fr/wmts?',
                crs: 'EPSG:3857',
                name: 'ORTHOIMAGERY.ORTHOPHOTOS',
                tileMatrixSet: 'PM',
                format: 'image/jpeg'
            });

            var colorLayer = new itowns.ColorLayer('Ortho', {
                source: colorSource,
            });

            view.addLayer(colorLayer);

            var elevationSource = new itowns.WMTSSource({
                url: 'https://data.geopf.fr/wmts?',
                crs: 'EPSG:4326',
                name: 'ELEVATION.ELEVATIONGRIDCOVERAGE.HIGHRES',
                tileMatrixSet: 'WGS84G',
                format: 'image/x-bil;bits=32',
                tileMatrixSetLimits: {
                    11: {
                        minTileRow: 442,
                        maxTileRow: 1267,
                        minTileCol: 1344,
                        maxTileCol: 2683
                    },
                    12: {
                        minTileRow: 885,
                        maxTileRow: 2343,
                        minTileCol: 3978,
                        maxTileCol: 5126
                    },
                    13: {
                        minTileRow: 1770,
                        maxTileRow: 4687,
                        minTileCol: 7957,
                        maxTileCol: 10253
                    },
                    14: {
                        minTileRow: 3540,
                        maxTileRow: 9375,
                        minTileCol: 15914,
                        maxTileCol: 20507
                    }
                }
            });

            var elevationLayer = new itowns.ElevationLayer('MNT_WORLD', {
                source: elevationSource,
            });

            view.addLayer(elevationLayer);

            function setAltitude(properties) {
                return properties.altitude_minimale_sol;
            }

            function setExtrusion(properties) {
                return properties.hauteur;
            }

            function setColor(properties) {
                return new itowns.THREE.Color(0xaaaaaa);
            }


            var geometrySource = new itowns.WFSSource({
                url: 'https://data.geopf.fr/wfs/ows?',
                version: '2.0.0',
                typeName: 'BDTOPO_V3:batiment',
                crs: 'EPSG:4326',
                ipr: 'IGN',
                format: 'application/json',
            });

            var geometryLayer = new itowns.FeatureGeometryLayer('Buildings', {
                source: geometrySource,
                zoom: { min: 14 },
                style: {
                    fill: {
                        color: setColor,
                        base_altitude: setAltitude,
                        extrusion_height: setExtrusion,
                    },
                },
            });

            view.addLayer(geometryLayer);
        </script>
     </body>
</html>