The goal of this tutorial is to give an example on how to use iTowns to visualize data in a global geocentric Coordinate Reference System (CRS). It shows how to display ortho-images as well as a Digital Elevation Model (DEM).
Preparing the webpage
The webpage we want to display data on should be structured as follows :
<!DOCTYPE html>
<html>
    <head>
        <meta charset="UTF-8">
        <title>Simple globe with iTowns</title>
        <style>
            html { height: 100%; }
            body { margin: 0; overflow: hidden; height: 100%; }
            #viewerDiv { margin: auto; height: 100%; width: 100%; padding: 0; }
            canvas { display: block }
        </style>
     </head>
     <body>
        <div id="viewerDiv"></div>
        <script src="../dist/itowns.js"></script>
        <script type="text/javascript">
            // Tutorial code should go here
        </script>
     </body>
</html>
What we are doing here is fairly simple :
- we create a container
<div id="viewerDiv"></div>that will contain the 3D view ; - we define the layout of this container within our webpage ;
- we import iTowns framework (which in our case is imported from the
dist/repository).
We will then add javascript to use iTowns to display data within a <script> markup following iTowns import.
To work as is, this web page should be placed in the examples/ folder of itowns but you can put it anywhere else as
long as you have a local web server and that you adapt the link to itowns (<script src="../dist/itowns.js"></script>).
Creating a view
In order to be able to display anything with iTowns, we always need to create a View, that will contain the data
layers. In this tutorial, we will use a GlobeView and add data layers in EPSG:4326 and in EPSG:3857 which
are the two CRS supported for data displayed in a GlobeView. We can add a GlobeView with the following
code:
var viewerDiv = document.getElementById('viewerDiv');
var placement = {
    coord: new itowns.Coordinates('EPSG:4326', 2.35, 48.8),
    range: 25e6
};
var view = new itowns.GlobeView(viewerDiv, placement);
First we get the element of the page on which the view will be displayed. Then, we create an object that contains camera
initial placement information. This object has two properties : a position which the camera is
facing (the lookAt coordinate of the camera, coord), and the distance between the camera and this coordinate (range)
in meters.
For the coord argument, we can create a Coordinates object in the WGS84 system - whose EPSG code is 4326.
Then, having those two objects, we create the GlobeView.
The result should be a simple blue globe like below.

Adding a color layer
Now that we have a globe, let's display data on it. For this, let's add a basic layer composed of aerial photos.
Adding a layer to itowns is done in three steps: creating a data Source, adding this source to a
Layer and adding this layer to the View.
var orthoSource = new itowns.WMTSSource({
    url: 'https://data.geopf.fr/wmts?',
    crs: 'EPSG:3857',
    name: 'ORTHOIMAGERY.ORTHOPHOTOS',
    tileMatrixSet: 'PM',
    format: 'image/jpeg',
});

var orthoLayer = new itowns.ColorLayer('Ortho', {
    source: orthoSource,
});

view.addLayer(orthoLayer);
Images that we chose to display are coming from a WMTS server, so we use a WMTSSource.
To declare this source, three elements are needed :
- a
url, describing the path to the WMTS service - a
crsprojection in which to fetch the data - a
name, used to build the URL for each image - a
tileMatrixSet, for the same purpose
A format is alse specified in our case, as we are looking for jpeg images.
Once the source is defined, we need to add it to a layer. We want to create and add a layer containing images,
ColorLayer is the right layer type to display raster images. ColorLayer, only needs an id of the
layer and the data source.
Finally, we simply add the layer to the view with addLayer.
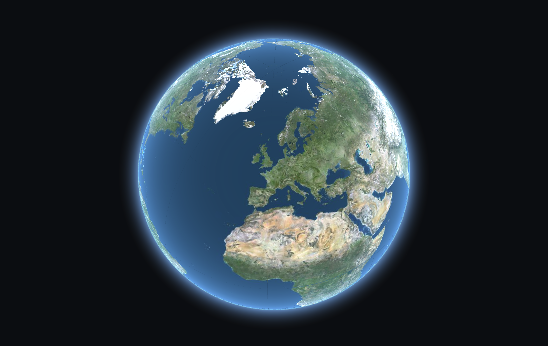
The result should be a globe with orthoimages on it:
Adding an elevation layer
We can add more depth to the current globe by providing an ElevationLayer. The
process is quite similar to adding a ColorLayer. In this case, we are also using a
WMTSSource, but we need to create a new one as the elevation data source is different from the
previous one.
var elevationSource = new itowns.WMTSSource({
    url: 'https://data.geopf.fr/wmts?',
    crs: 'EPSG:4326',
    name: 'ELEVATION.ELEVATIONGRIDCOVERAGE.SRTM3',
    tileMatrixSet: 'WGS84G',
    format: 'image/x-bil;bits=32',
    zoom: {min: 3, max: 10}
});

var elevationLayer = new itowns.ElevationLayer('MNT_WORLD', {
    source: elevationSource,
});

view.addLayer(elevationLayer);
Two things have changed:
- the configuration of the
WMTSSource, adapted to fit the data source and azoomproperty was added. It contains the minimum and maximum zoom levels, between which data shall be fetched in the data source. - the layer created, which is an
ElevationLayer
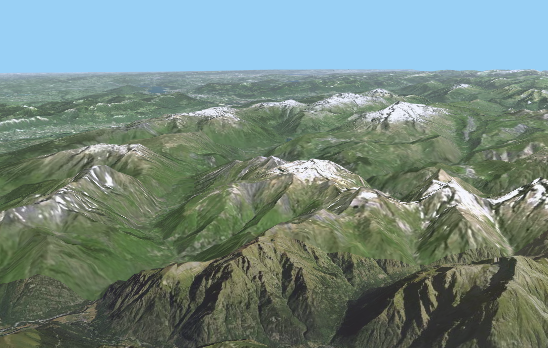
Now we can zoom in and see some elevations and beautiful mountains !
Result
Congratulations ! You are now able to display a GlobeView with an ElevationLayer and a ColorLayer.
Here is the final code:
<!DOCTYPE html>
<html>
    <head>
        <meta charset="UTF-8">
        <title>Simple globe with iTowns</title>
        <style>
            html { height: 100%; }
            body { margin: 0; overflow: hidden; height: 100%; }
            #viewerDiv { margin: auto; height: 100%; width: 100%; padding: 0; }
            canvas { display: block }
        </style>
     </head>
     <body>
        <div id="viewerDiv"></div>
        <script src="../dist/itowns.js"></script>
        <script type="text/javascript">
            var viewerDiv = document.getElementById('viewerDiv');
            var placement = {
                coord: new itowns.Coordinates('EPSG:4326', 2.351323, 48.856712),
                range: 25000000
            };
            var view = new itowns.GlobeView(viewerDiv, placement);

            var orthoSource = new itowns.WMTSSource({
                url: 'https://data.geopf.fr/wmts?',
                crs: "EPSG:3857",
                name: 'ORTHOIMAGERY.ORTHOPHOTOS',
                tileMatrixSet: 'PM',
                format: 'image/jpeg',
            })

            var orthoLayer = new itowns.ColorLayer('Ortho', {
                source: orthoSource,
            });

            view.addLayer(orthoLayer);

            var elevationSource = new itowns.WMTSSource({
                url: 'https://data.geopf.fr/wmts?',
                crs: 'EPSG:4326',
                name: 'ELEVATION.ELEVATIONGRIDCOVERAGE.SRTM3',
                tileMatrixSet: 'WGS84G',
                format: 'image/x-bil;bits=32',
                zoom: {min: 3, max: 10},
            });

            var elevationLayer = new itowns.ElevationLayer('MNT_WORLD', {
                source: elevationSource,
            });

            view.addLayer(elevationLayer);
        </script>
     </body>
</html>