The goal of this tutorial is to give an example on how to use iTowns to visualize data that are in RGF93 / Lambert-93 Coordinate Reference System (CRS). We will display a Digital Elevation Model (DEM) and layer ortho-images from the French Geoportail API on it.
Preparing the webpage
The webpage we want to display data on should be structured as follows :
<!DOCTYPE html>
<html>
    <head>
        <meta charset="UTF-8">
        <title>Display a planar view with iTowns</title>
        <style>
            html { height: 100%; }
            body { margin: 0; overflow: hidden; height: 100%; }
            #viewerDiv { margin: auto; height: 100%; width: 100%; padding: 0; }
            canvas { display: block }
        </style>
    </head>
    <body>
        <div id="viewerDiv"></div>
        <script src="../dist/itowns.js"></script>
        <script type="text/javascript">
            // Tutorial code should go here
        </script>
    </body>
</html>
What we are doing here is fairly simple :
- we create a container
<div id="viewerDiv"></div>that will contain the 3D view ; - we define the layout of this container within our webpage ;
- we import iTowns framework (which in our case is imported from the
dist/repository).
We will then add javascript to use iTowns to display data within a <script> markup following iTowns import.
To work as is, this web page should be placed in the examples/ folder of itowns but you can put it anywhere else as
long as you have a local web server and that you adapt the link to itowns (<script src="../dist/itowns.js"></script>).
Create a view
As mentioned in fundamentals tutorial, we need a View to support any geographic data we wish to display.
What we want here is to display data in a RGF93 / Lambert-93 projection, which is a conic local projection.
Therefore, we should use a PlanarView, which is a specific type of View adapted to local projections.
We can create it as such :
const viewerDiv = document.getElementById('viewerDiv');

itowns.proj4.defs(
    'EPSG:2154',
    '+proj=lcc +lat_1=49 +lat_2=44 +lat_0=46.5 +lon_0=3 +x_0=700000 +y_0=6600000 +ellps=GRS80 +towgs84=0,0,0,0,0,0,0 +units=m +no_defs'
);
const viewExtent = new itowns.Extent(
    'EPSG:2154',
    644500.0, 659499.99,
    6857500.0, 6867499.99,
);

const view = new itowns.PlanarView(viewerDiv, viewExtent);
Several things are done here :
- First, we retrieve the
DomElementrelative to the container we created that will contain iTowns visualisation. - Then we define the geographic extent of our view by instantiating iTowns
Extentclass. To do so, we need to pass five argument toExtentconstructor, which are :- The Coordinates Reference System (CRS) of the extent, given as its EPSG code.
Here, we use RGF93 / Lambert-93 CRS.
Not all CRS are defined by default within iTowns, which is why we need to define our CRS using proj4 prior to instantiating the
Extent; - The westernmost, easternmost, southernmost and northernmost coordinates of the extent.
- The Coordinates Reference System (CRS) of the extent, given as its EPSG code.
Here, we use RGF93 / Lambert-93 CRS.
Not all CRS are defined by default within iTowns, which is why we need to define our CRS using proj4 prior to instantiating the
- Finally, we create a
PlanarViewgiving it the requiredDomElementandExtentparameters.
At this stage, our webpage should look like this :

The blue rectangle you can see is the view we just created.
By default, iTowns positions the camera on top of the view center.
We can change the initial camera position by passing a CameraTransformOption object as an optional parameter of PlanarView constructor.
To do so, we first need to create our CameraTransformOption object :
const placement = {
    coord: viewExtent.center(),
    tilt: 12,
    heading: 40,
    range: 16000,
}
We are specifying here that the camera should target the center of the extent, with an azimuth of 40 degrees and a pitch of 12 degrees under the horizontal plane. The camera should also be at a distance of 16000 meters from its target (i.e. from the view extent center).
We can then just pass this object to the PlanarView constructor parameters :
const view = new itowns.PlanarView(viewerDiv, viewExtent, {
    placement: placement,
});
Our webpage should now look like this :

Now that we have created a view, we will use it to display geographic data.
Add a color layer
The first data we want to display on our planar surface is ortho-images.
To do so, we must define the source at which ortho-images data can be fetched thanks to the Source class.
We can start displaying ortho-images provided by the Geoportail as such :
const sourceOrtho = new itowns.WMSSource({
    url: "https://data.geopf.fr/wms-r/wms?",
    name: "OI.OrthoimageCoverage.HR",
    format: 'image/png',
    crs: 'EPSG:2154',
    extent: viewExtent,
});
const layerOrtho = new itowns.ColorLayer('Ortho', { source: sourceOrtho });
view.addLayer(layerOrtho);
In this code, we first define the source specifications of the data we wish to fetch.
WMSSource has several mandatory parameters :
- the server
url, thenameof the data and theirformat, which are used to generate the finalurlat which data shall be fetched ; - the CRS of the fetched data ;
- the geographic extent of the resources (set here as the extent of the view).
Then we create a ColorLayer from two parameters : a unique id for the layer (Ortho) as well as the Source instance for the layer data.
Finally, we add the created layer to the view with view.addLayer(layerOrtho);.
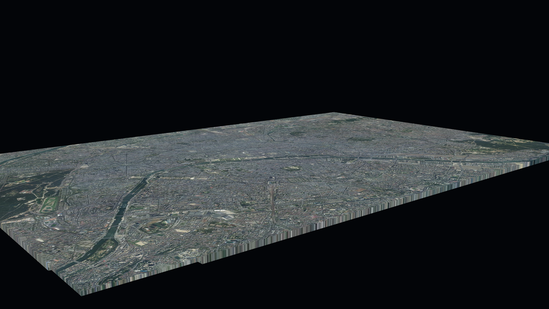
The result we get at this stage is the following, where we can see the newly added ortho-imagery layer :
Add an elevation layer
The process of adding an ElevationLayer is similar to what we just did with the ColorLayer.
At first, we need to define the source of the elevation raster data.
Then we can simply create the ElevationLayer, giving it a unique id and the source configuration, and finally adding it to the view.
const sourceDEM = new itowns.WMSSource({
    url: "https://data.geopf.fr/wms-r/wms?",
    name: "ELEVATION.ELEVATIONGRIDCOVERAGE.HIGHRES",
    format: "image/x-bil;bits=32",
    crs: 'EPSG:2154',
    extent: viewExtent,
});
const layerDEM = new itowns.ElevationLayer('DEM', { source: sourceDEM });
view.addLayer(layerDEM);
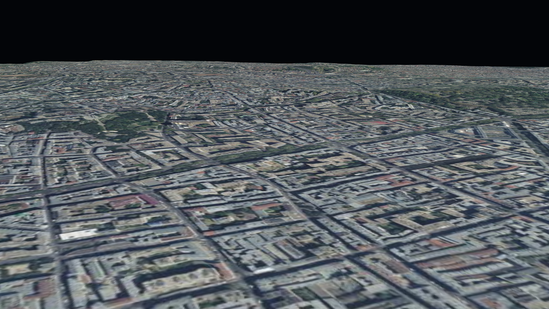
The result is shown bellow. The camera has been zoomed in to get a more precise rendering of the elevation variations, which are not very important on the extent we chose to display.
Result
With this tutorial, we have learnt how to use iTowns ColorLayer and an ElevationLayer to display data in a local conic projection.
The code that is shown bellow sums up all the steps it took to do so.
<!DOCTYPE html>
<html>
    <head>
        <meta charset="UTF-8">
        <title>Display a planar view with iTowns</title>
        <style>
            html { height: 100%; }
            body { margin: 0; overflow: hidden; height: 100%; }
            #viewerDiv { margin: auto; height: 100%; width: 100%; padding: 0; }
            canvas { display: block }
        </style>
    </head>
    <body>
        <div id="viewerDiv"></div>
        <script src="../dist/itowns.js"></script>
        <script type="text/javascript">

            // Retrieve the view container
            const viewerDiv = document.getElementById('viewerDiv');

            // Define the view geographic extent
            itowns.proj4.defs(
                'EPSG:2154',
                '+proj=lcc +lat_1=49 +lat_2=44 +lat_0=46.5 +lon_0=3 +x_0=700000 +y_0=6600000 +ellps=GRS80 +towgs84=0,0,0,0,0,0,0 +units=m +no_defs'
            );
            const viewExtent = new itowns.Extent(
                'EPSG:2154',
                644500.0, 659499.99,
                6857500.0, 6867499.99,
            );

            // Define the camera initial placement
            const placement = {
                coord: viewExtent.center(),
                tilt: 12,
                heading: 40,
                range: 16000,
            };

            // Create the planar view
            const view = new itowns.PlanarView(viewerDiv, viewExtent, {
                placement: placement,
            });

            // Define the source of the ortho-images
            const sourceOrtho = new itowns.WMSSource({
                url: "https://data.geopf.fr/wms-r/wms?",
                name: "OI.OrthoimageCoverage.HR",
                format: "image/png",
                crs: 'EPSG:2154',
                extent: viewExtent,
            });
            // Create the ortho-images ColorLayer and add it to the view
            const layerOrtho = new itowns.ColorLayer('Ortho', { source: sourceOrtho });
            view.addLayer(layerOrtho);

            // Define the source of the dem data
            const sourceDEM = new itowns.WMSSource({
                url: "https://data.geopf.fr/wms-r/wms?",
                name: "ELEVATION.ELEVATIONGRIDCOVERAGE.HIGHRES",
                format: "image/x-bil;bits=32",
                crs: 'EPSG:2154',
                extent: viewExtent,
            });
            // Create the dem ElevationLayer and add it to the view
            const layerDEM = new itowns.ElevationLayer('DEM', { source: sourceDEM });
            view.addLayer(layerDEM);
        </script>
    </body>
</html>