Style
ITowns can display vector data in two ways : the data can be displayed in a
View as 3D objects, or as entities that are projected on the ground.
You can see bellow pictures illustrating the two cases.
 |
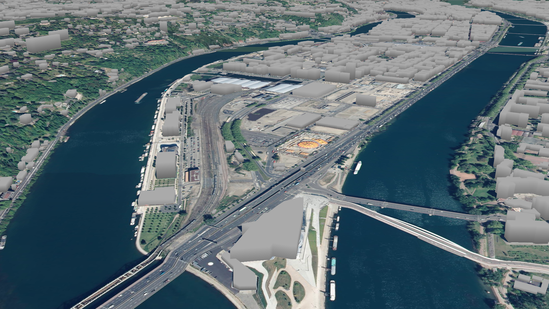 |
| Vector data projected on the ground |
Vector data display as 3D objects |
In both ways, the appearance and positioning of the vector data can be adjusted
by modifying the Style parameter of the Layer the data is
displayed in. The Style in iTowns comes with several properties:
fill allows defining style rules for polygons interior,stroke allows defining style rules for lines and polygons edges,point allows defining style rules for points.
Each of these three properties comes with a bunch of parameters to set vector
data appearance and positioning, such as color, opacity, width,
base_altitude… You can find a list of all the possible parameters in
Style documentation.
These parameters can be set as static values or as functions of the vector data
properties. For example, let’s suppose some vector data contains polygons.
Setting fill.color to red will color all the polygons in red. If on another
hand, all polygons come with a color property within the vector data, you can
access it within Style in two ways:
- either by using brackets, which in our example results in setting
fill.color
to '{color}' ;
- or by passing a method to the
fill.color value. The first parameter of this
method will automatically be an object containing all the properties of the
vector data. In our example, the method could simply return the color
property.
ITowns offers the possibility to display labels attached to points. The content
and appearance of the labels can be set the same way as for the polygons, lines
and points: using a Style property which is called text. For
instance, setting text.field to '{name}' will display a label on each point
that has a name property within the vector data. The content of the label will
be the content stored in the data under the name property.
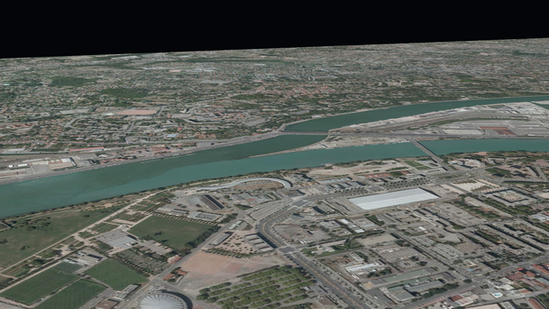
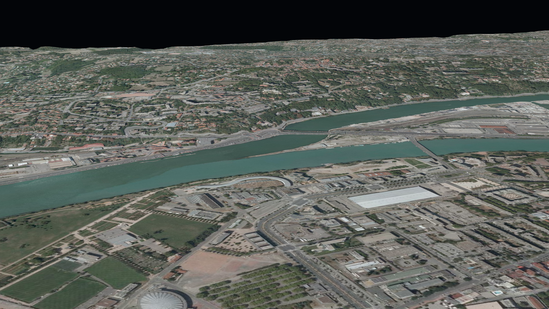
Vector data projected on the ground
When vector data are flattened on the ground, they are displayed in a
ColorLayer. In that case, the data basically consist in polygons,
lines or points. Their appearance can be adjusted by modifying the
Style of the ColorLayer. Yet, their positioning can’t be
modified since it is computed so that tey appear projected on the ground.
→Visit tutorial
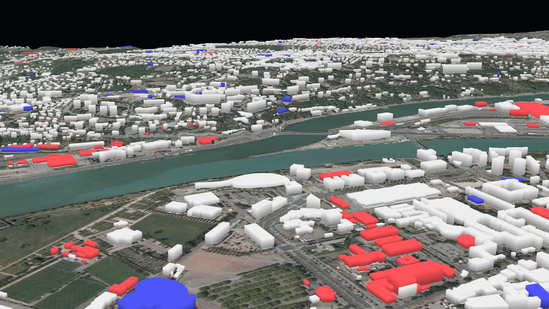
Vector data displayed as 3D objects
In the case of vector data represented as 3D objects, the data are displayed in
a GeometryLayer. The appearance and positioning of the vector data
can be adjusted by modifying the Style of the
GeometryLayer. Two parameters allow modifying the data position:
base_altitude which defines the altitude at the base of the 3D objects ;extrusion_height which defines the height of the 3D objects, giving them
volume.
For example, given a set of polygons, setting fill.base_altitude to 500 and
fill.extrusion_height to 20 will render extruded polygon expanding between
500 and 520 meters of altitude.
→Visit tutorial